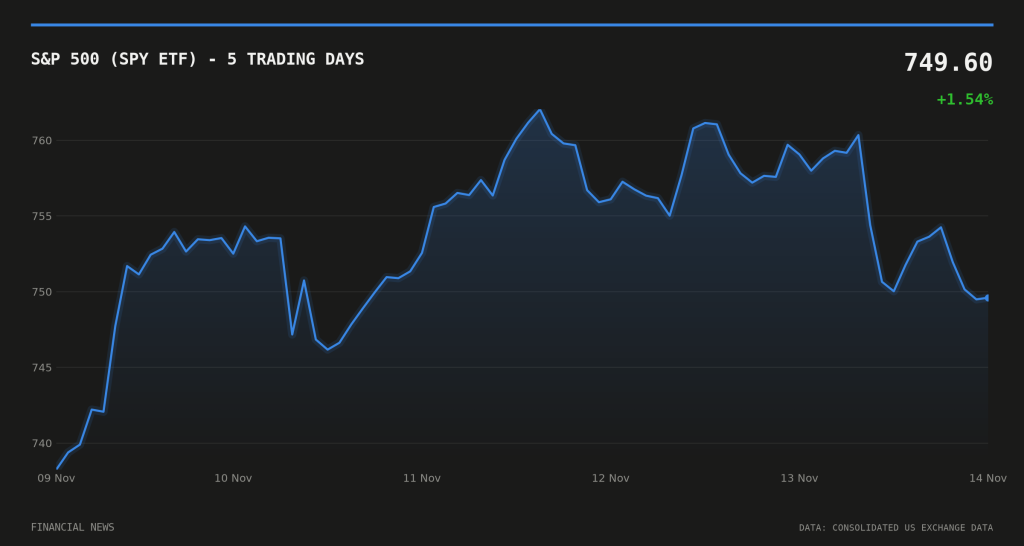
The Wall Street weekly close for 14 November 2026 showed broad indices pushing higher even as the chip sector split violently down the middle. The S&P 500, tracked here via the SPY ETF, rose 1.54% on the week to close at 749.60.
That gain came with a catch: the rally was not evenly spread. Some of the same semiconductor names that powered markets higher earlier in the year became this week’s biggest laggards, while a different set of chip-adjacent and infrastructure stocks took their place at the top of the leaderboard.
The scoreboard: a Wall Street weekly close with broad gains
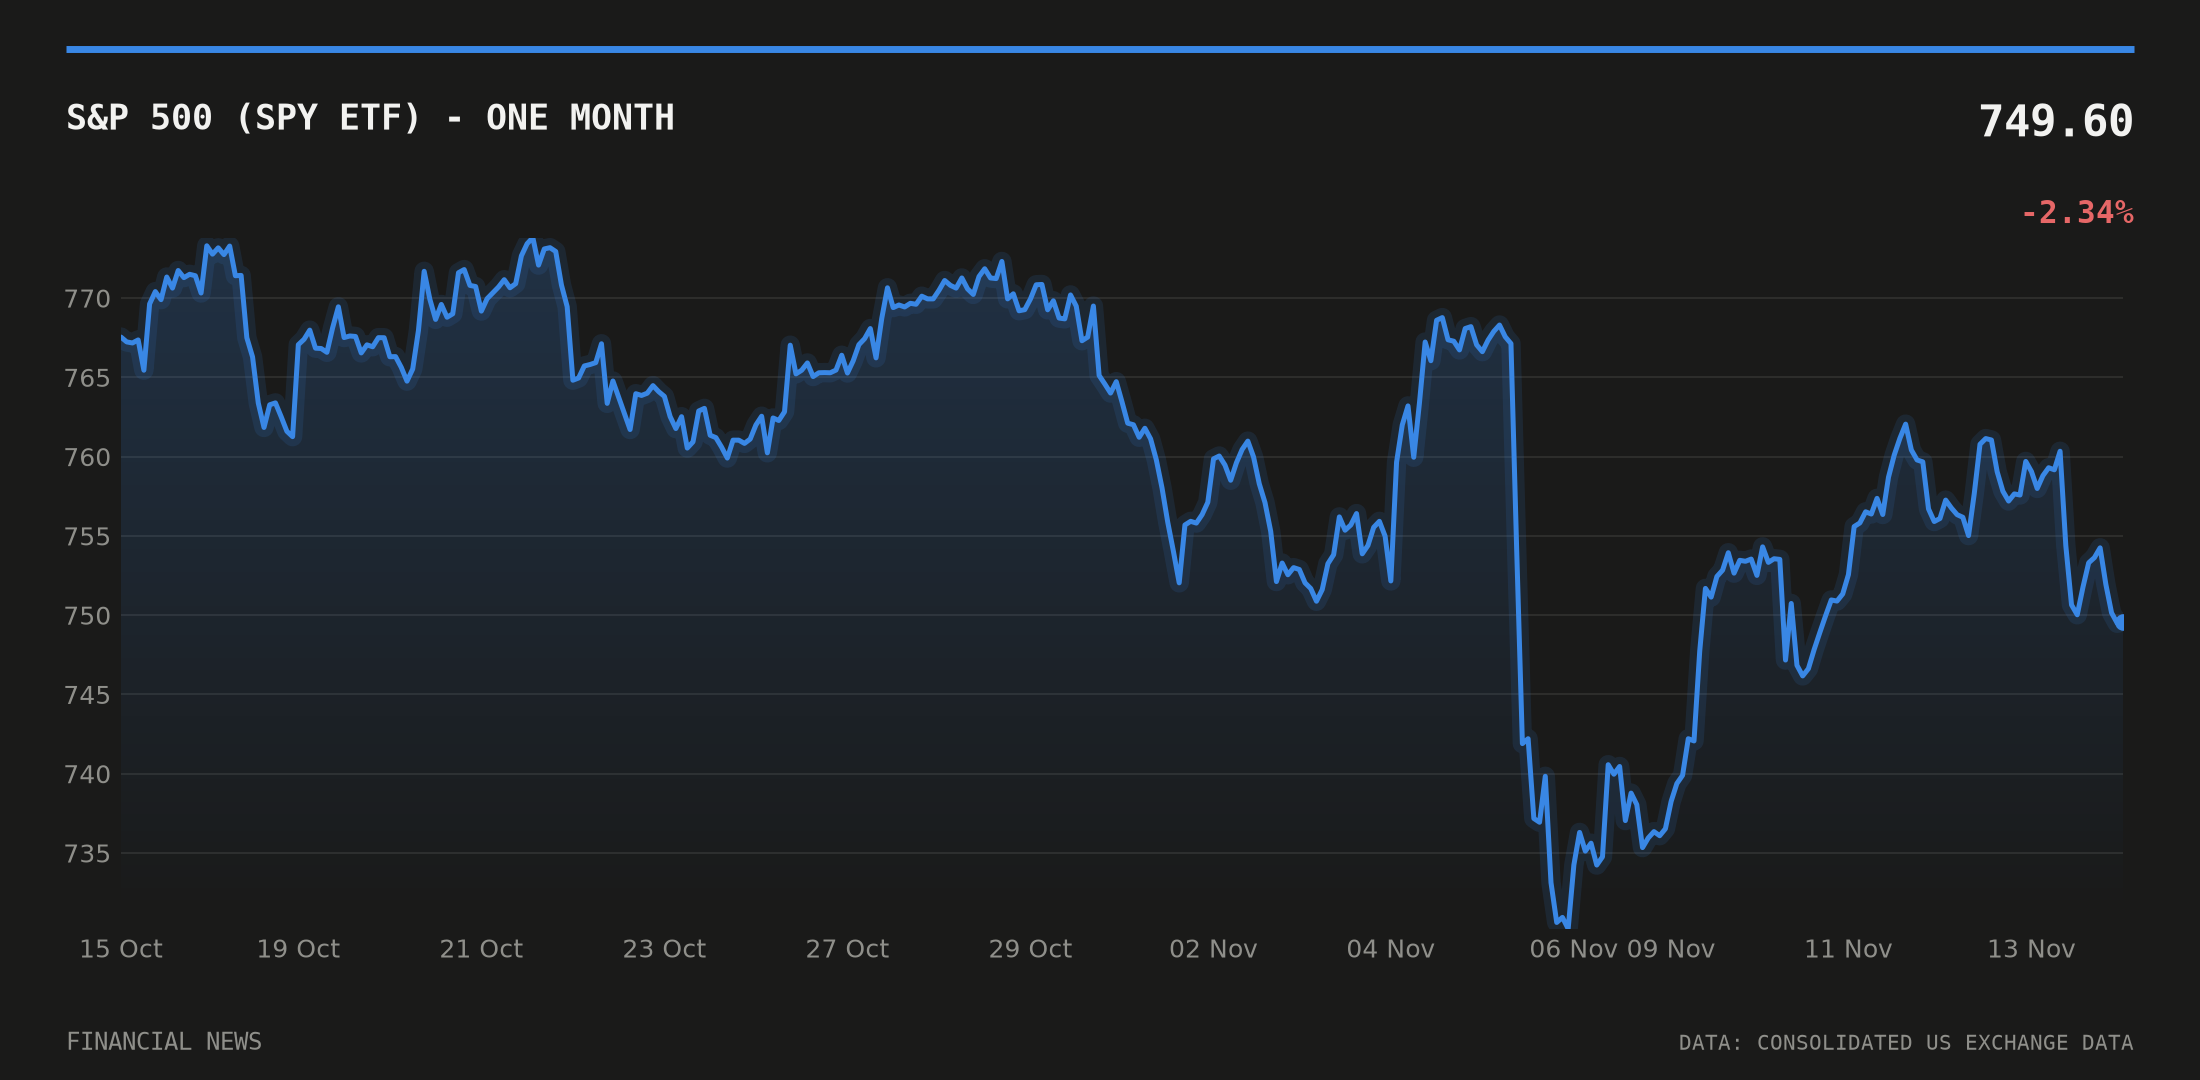
All three major gauges finished the week higher. The Nasdaq 100, via the QQQ ETF, led the pack with a 2.56% weekly gain to 674.25, outpacing both the S&P 500 and the Dow. The Dow, tracked through the DIA ETF, rose a more modest 1.06% to 521.21.
The gap between the Nasdaq 100’s advance and the Dow’s tells its own story: growth and technology names outran the more defensive, industrial-heavy blue-chip index for a second straight stretch. Financial News covered the inverse pattern the previous week in The Weekly Close: Chip Slump Drags Wall Street Lower, when chip weakness dragged the broader market down. This week’s Wall Street weekly close shows the rotation running in the other direction, even if the chip sector itself produced some of the week’s sharpest losses alongside its gains.
Winners of the week
Monolithic Power Systems (MPWR) topped the gainers’ table, surging 19.59% to close at 1,380.94. Charter Communications (CHTR) followed with a 16.29% weekly advance to 138.39.
CoreWeave (CRWV) climbed 15.21% to 51.90, a week in which the company’s chief executive also wrote to Texas’s governor-elect on data-centre concerns, as Financial News reported. Arista Networks (ANET) added 14.73% to finish at 195.50, and Advanced Micro Devices (AMD) rose 14.62% to 525.17, rounding out a week in which networking and power-hungry data-centre suppliers outperformed the chipmakers that depend on them for end demand.
Losers of the week
Moderna (MRNA) was the week’s heaviest faller, down 15.06% to 220.46. First Solar (FSLR) dropped 14.31% to 170.00.
Strategy Inc (MSTR) fell 11.30% to 110.00, and Nebius Group (NBIS) declined 10.38% to 112.96. Nvidia (NVDA) rounded out the bottom five, down 9.57% to 161.38 — a reversal for a stock that has anchored much of the broader market’s gains through the year, and a reminder that the chip trade cuts both ways within the same five trading days that lifted AMD and Arista.
The macro shift: yields climb across the curve
Treasury yields moved higher across the curve this week. The 10-year Treasury yield rose to 5.10% as of 12 November, from 4.98% previously, according to data from FRED, the Federal Reserve Bank of St. Louis.
The 2-year yield climbed to 4.86% from 4.73% over the same window. The 10-year/2-year spread widened slightly to 0.27 percentage points from 0.24, keeping the curve positively sloped but only modestly so. WTI crude oil held flat at $89.62 a barrel, unchanged from the prior reading, suggesting the equity rally and the yield move were not being driven by energy price swings.
Rising yields alongside rising equity indices is not the most common pairing, and it puts pressure on the valuation arguments for the most rate-sensitive growth names — precisely the cohort that produced both this week’s biggest winners and its biggest losers. Elsewhere in the market, this week also brought earnings and corporate news from across sectors that Financial News covered as it broke, including Constellation’s raised guidance after a 66% earnings jump and KKR’s record fee income in the third quarter, both filed against the same backdrop of climbing yields.
The number of the week
The number that matters from this Wall Street weekly close is 19.59% — Monolithic Power Systems’ weekly gain, the largest move of any stock tracked this week in either direction. It sits against a 9.57% weekly decline for Nvidia, the two moves bookending a week in which the Nasdaq 100’s 2.56% advance masked just how unevenly the gains were distributed beneath the index level. With the 10-year Treasury yield now at 5.10% and still climbing, market participants will be watching whether next week’s data releases ease or add to the pressure building at the long end of the curve.
This article is for information only and is not investment advice or a recommendation to buy or sell any asset. Markets move quickly; figures are correct as sourced at the time of writing. Always do your own research before making financial decisions.