
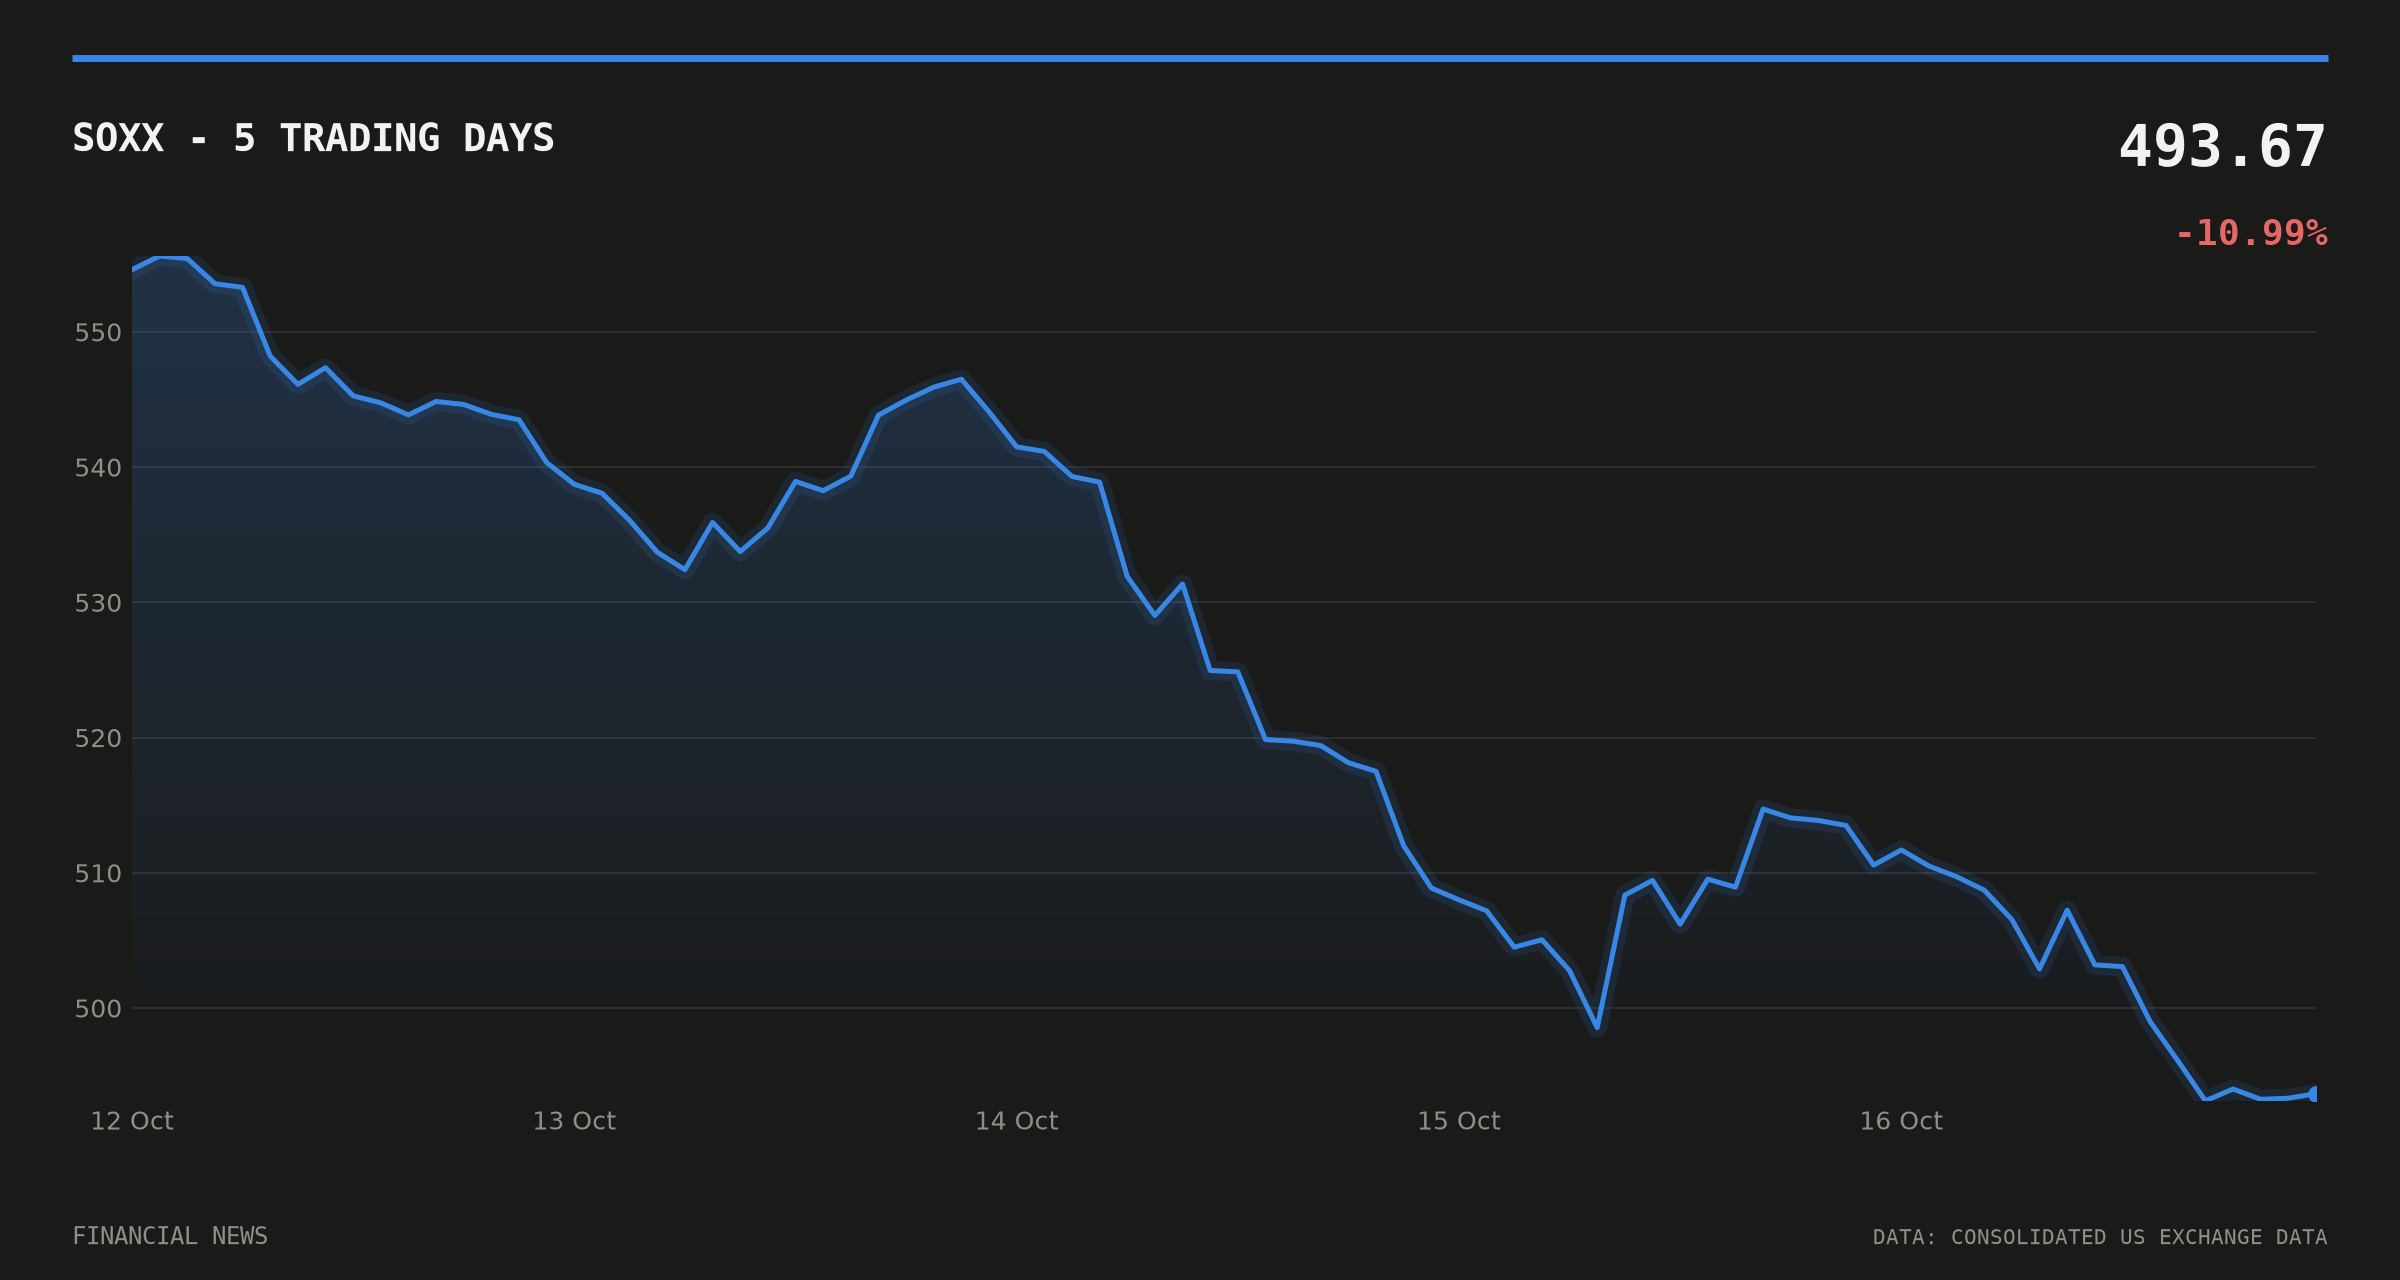

Semiconductor stocks have suffered their worst multi-day slide in years, but market reports disagree on exactly how long the chip stocks losing streak has run. The iShares Semiconductor ETF (NASDAQ: SOXX) closed at $493.67 on 16 October 2026, near its 20-day low of $493.14, according to consolidated exchange data cited by Benzinga.
The fund is down 11.6% over 20 trading days, with volume running at 2.49 times its 20-day average – a sign of heavy, sustained selling rather than a single bad session.
Two Outlets, Two Different Streaks
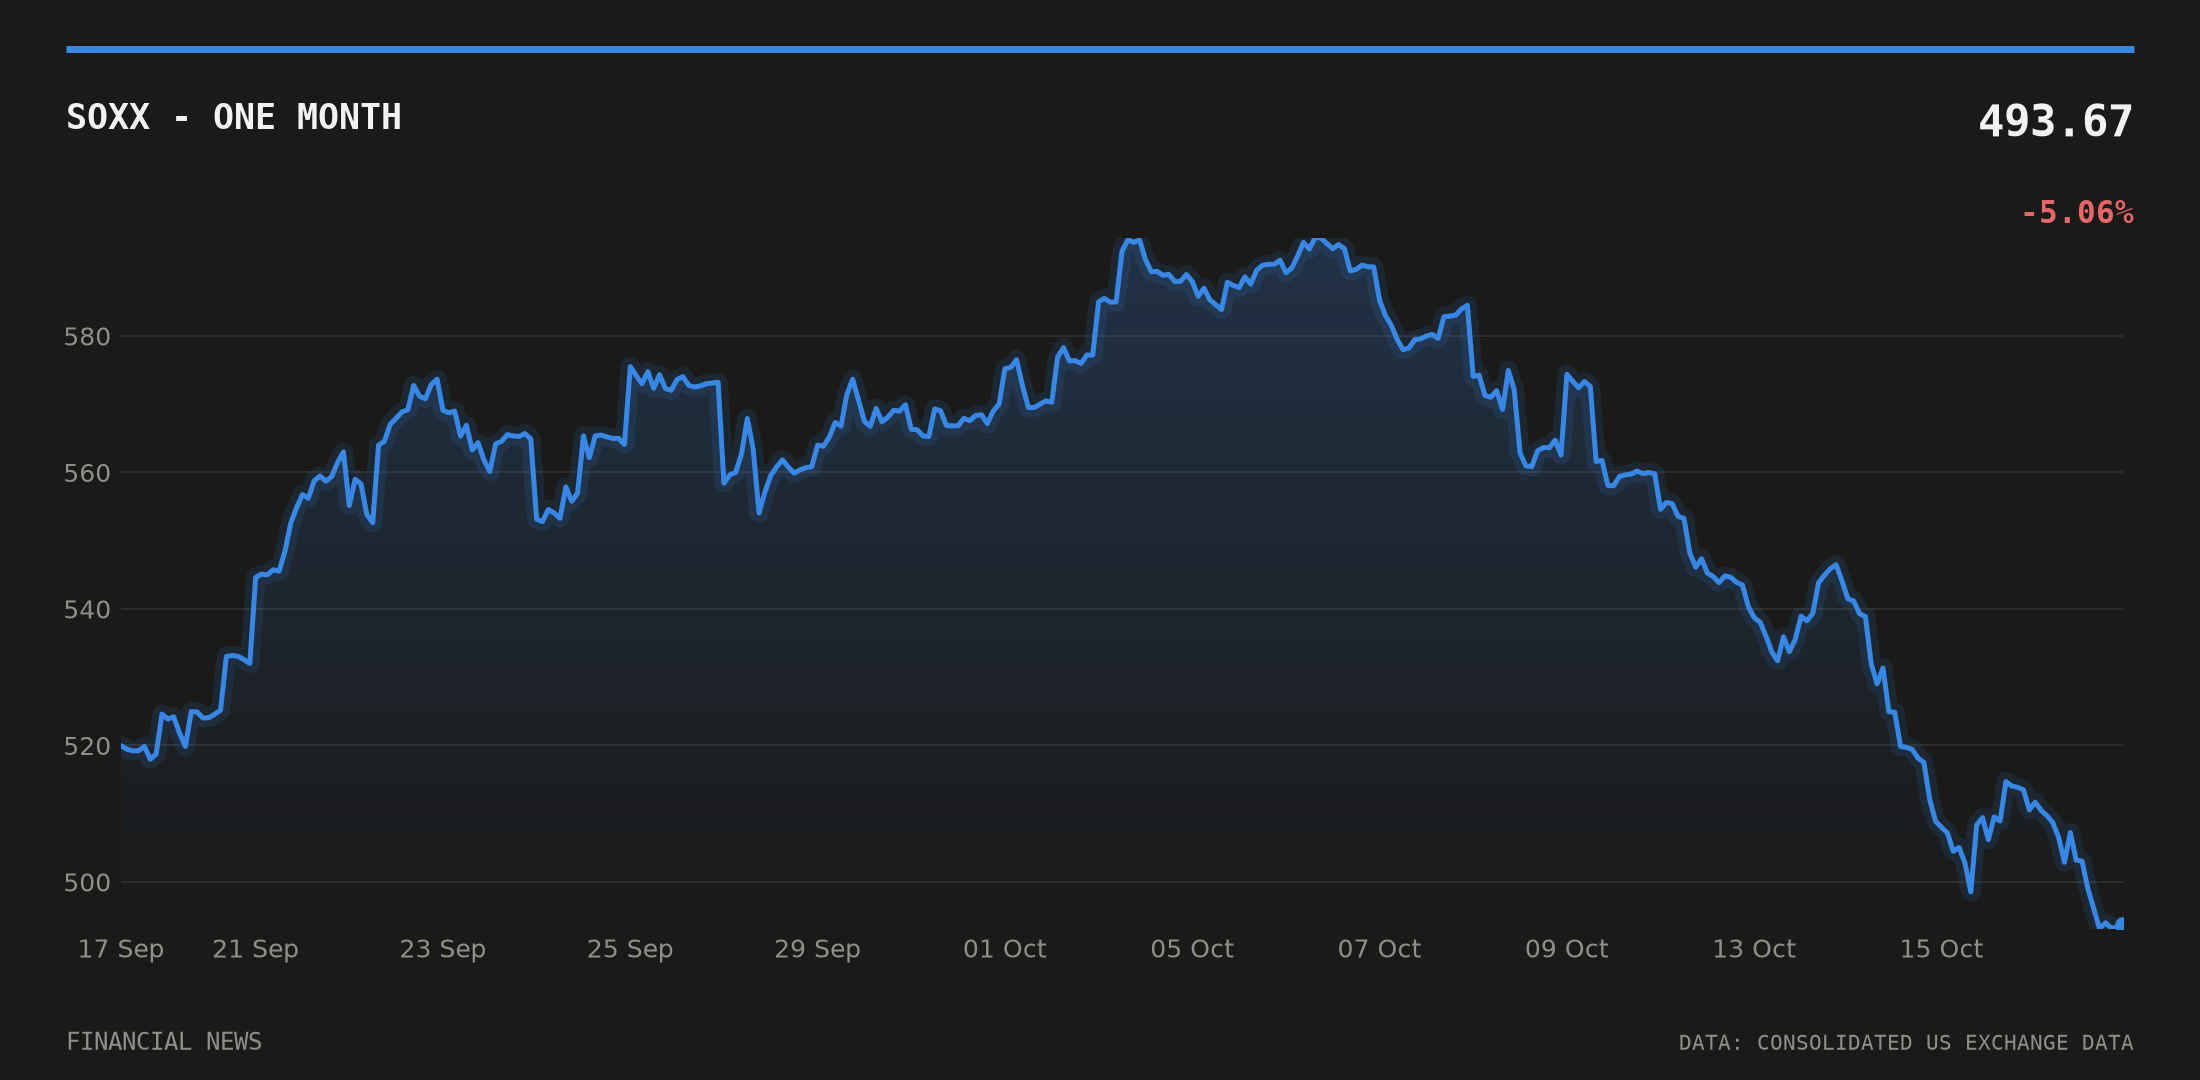
Benzinga reported that SOXX fell for a ninth straight session through Friday 16 October, calling it the longest skid since May 2006. A separate account from 247wallst.com put the run at eight consecutive days, the longest since 2008.
The two figures cannot both be the precise count, and neither this outlet nor the underlying market data can resolve which tally is correct. What is not in dispute is the direction: SOXX has traded consistently lower since early October, with little intraday relief.
CoreWeave Named as the Trigger, but the Case Is Thin
Both reports point to credit concerns around CoreWeave as the spark, framing the sell-off as investors asking who ultimately funds the AI buildout. No bond pricing, credit-rating action or company filing in the public record available to this desk corroborates that claim directly.
That leaves the CoreWeave link as reported narrative rather than a confirmed catalyst. Readers should treat it as the explanation offered by the two outlets covering the move, not as an established fact tied to a specific disclosure or rating action.
The 2006 Comparison
The rhyme with 2006 rests on interest rates. The Federal Reserve lifted its benchmark to 5.00% that May, its sixteenth straight increase, and emerging-market equities and commodities sold off alongside chip stocks.
Today’s setting is different in degree but similar in shape. The Fed raised rates to a 3.75%-4.00% range in September 2026. The 10-year Treasury yield stood at 5.1% on 15 October, matching the prior day’s 5.19% closely, according to data from the Federal Reserve Bank of St. Louis. The 2-year yield sat at 4.77%, down from 4.82%, while the 10-year/2-year spread widened slightly to 0.35 from 0.33, per the same source.
Inflation and employment data add texture rather than alarm. US CPI rose to 336.3 in September from 334.1 the month before, and unemployment edged up to 4.2% from 4.1%, both per FRED. Neither series points to the kind of acute tightening shock that preceded the 2006 chip downturn, even as yields sit at multi-year highs.
Short Interest Climbed Through the Sell-off
Positioning data shows traders leaning into the move rather than against it. FINRA’s daily short-sale volume ratio for SOXX rose from 0.46 on 8 October to 0.667 on 5 October and 0.619 on 15 October, according to FINRA figures. A ratio above 0.6 means more than six in ten shares traded that day were sold short – consistent with bearish bets building as the index fell, though the data does not establish cause.
Specific figures circulating for the scale of the drop – a 14% loss since 5 October and a 9.4% weekly decline – do not reconcile cleanly with the ETF’s own 20-day change of 11.6%. This article uses the 11.6% figure because it is the one tied directly to verifiable closing prices.
What Happens Next
Chipmakers with direct exposure to AI infrastructure spending, including Applied Materials (NASDAQ: AMAT) and Broadcom (NASDAQ: AVGO), remain the names investors are watching most closely for signs the sell-off is broadening or stabilising. Traders will also watch whether CoreWeave or its counterparties issue any disclosure that substantiates the credit concerns now being cited as the proximate cause – absent that, the sector’s losing streak remains better explained by the combination of stretched valuations and a less accommodative rate backdrop than by any single company event.
This article is for information only and is not investment advice or a recommendation to buy or sell any asset. Markets move quickly; figures are correct as sourced at the time of writing. Always do your own research before making financial decisions.
