
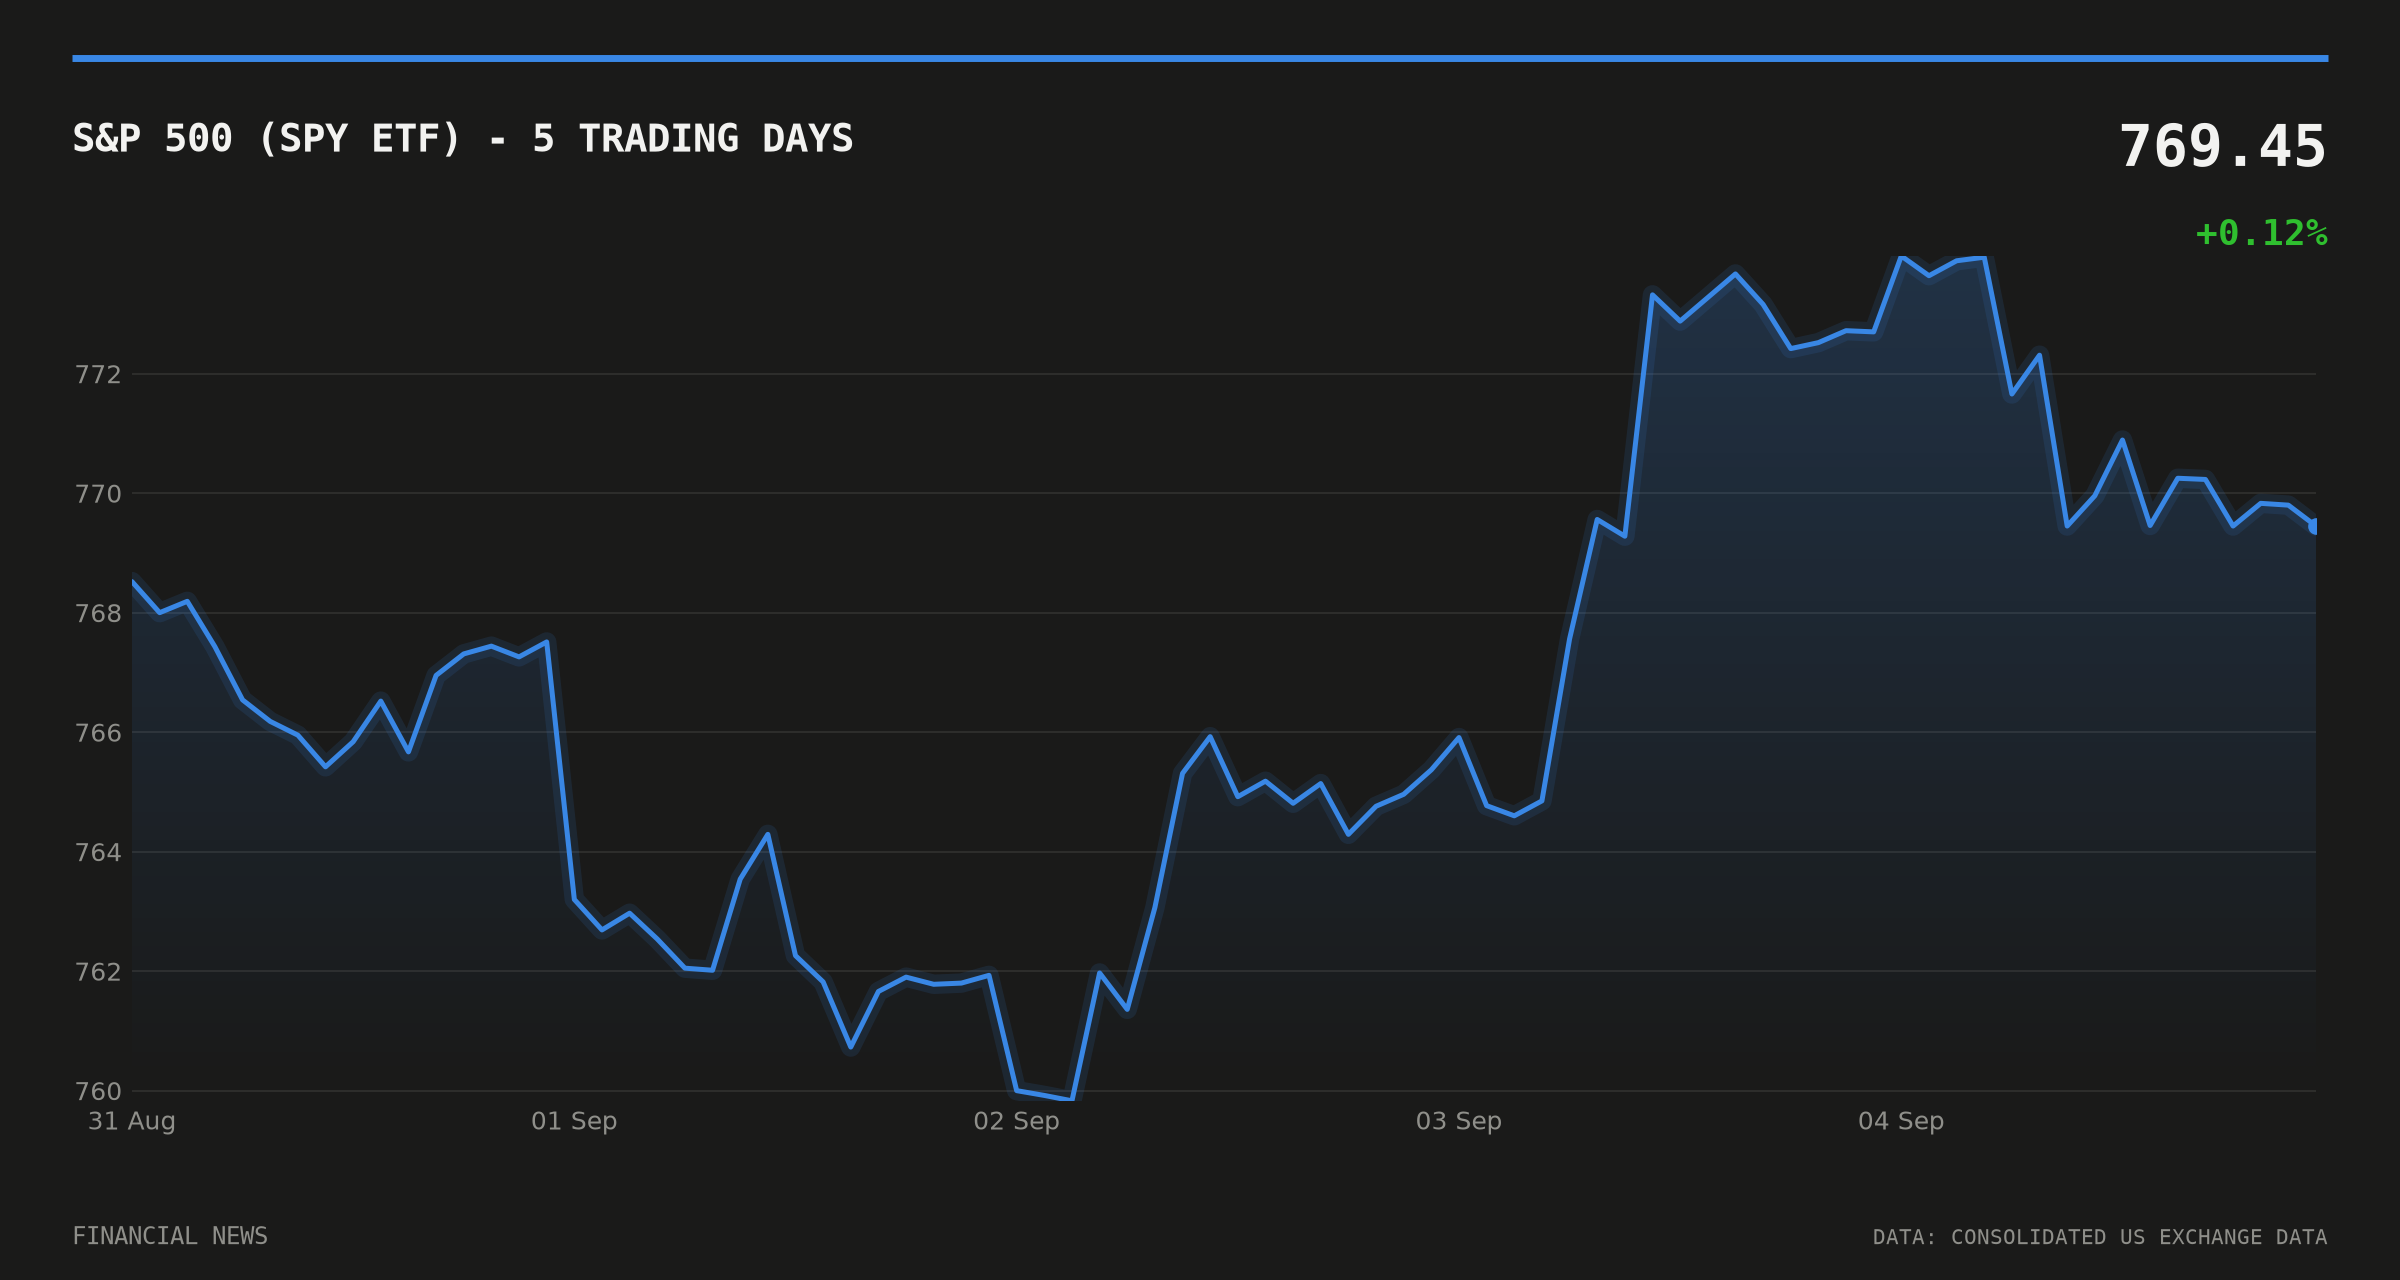

The S&P 500 weekly close for the week to 5 September 2026 showed almost no movement at the index level, with the SPY ETF proxy adding just 0.12% to end at 769.45. Beneath that calm surface, individual stocks swung by double digits in both directions.
Robinhood Markets (NASDAQ: HOOD) led gainers with a 16.9% weekly advance to $121.99, while Fair Isaac (NYSE: FICO) led decliners, falling 18.67% to $934.52. The gap between the index and its components was the week’s defining feature.
The scoreboard: a market going nowhere on average
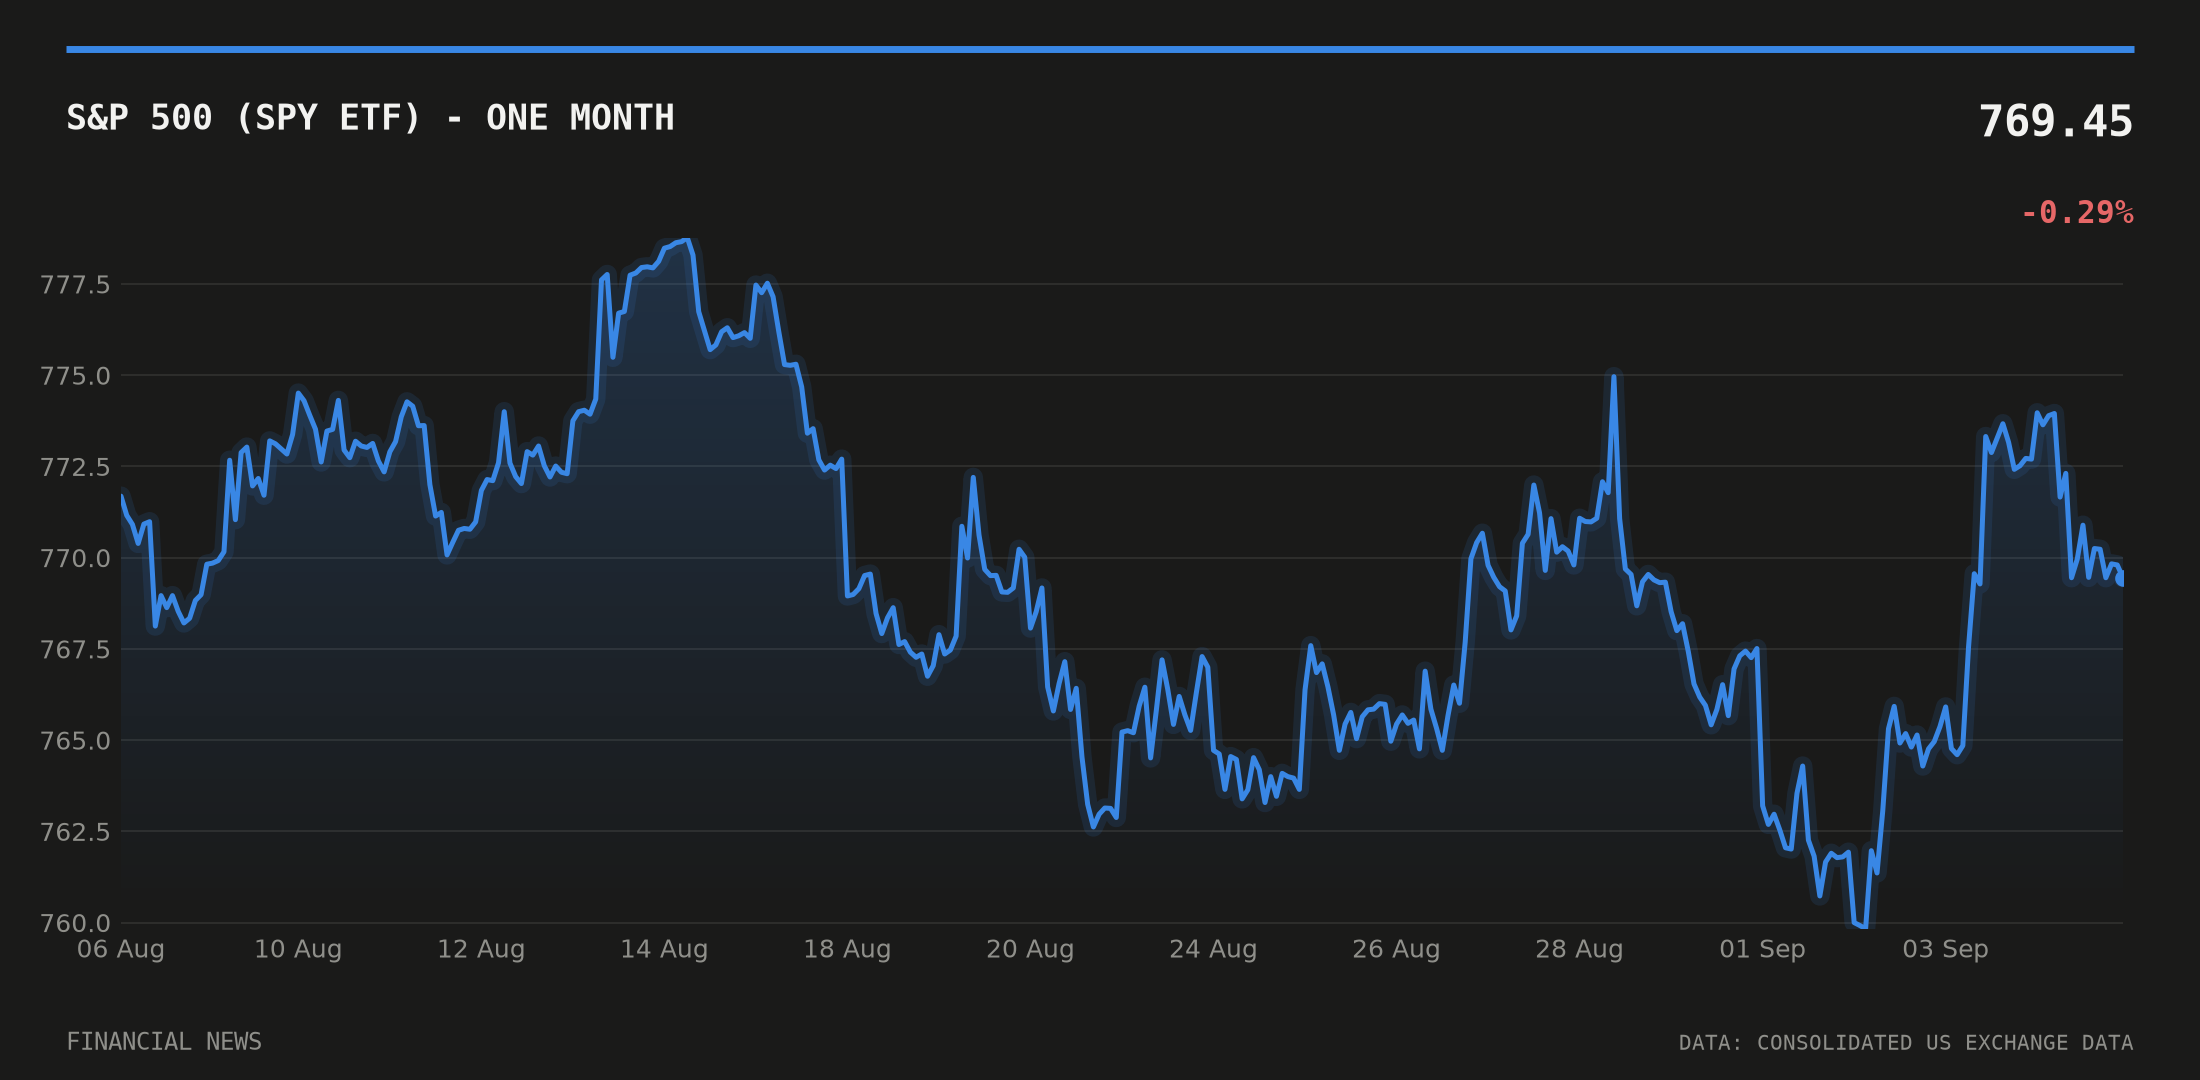
The S&P 500 (SPY) added 0.12% on the week to close at 769.45. The Nasdaq 100, tracked via the QQQ ETF, rose a little further, up 0.18% to 717.50. The Dow, via the DIA ETF, was the week’s laggard among the three, slipping 0.29% to 532.88.
None of the three benchmarks moved by more than half a percentage point. For a week that produced 18-point swings in single stocks, the blue-chip average told almost none of the story.
Winners: Robinhood, Sandisk and Dell lead a chip-and-broker rally
Robinhood topped the leaderboard, up 16.9% to $121.99. Sandisk (NASDAQ: SNDK) was close behind, gaining 16.11% to close at $1,732.99. Dell Technologies (NYSE: DELL) rose 14.32% to $522.44, Skyworks Solutions (NASDAQ: SWKS) climbed 13.47% to $74.02, and Dollar General (NYSE: DG) rounded out the top five with an 11.16% gain to $133.40.
The five biggest gainers spanned brokerage, storage, PCs, semiconductors and discount retail — a spread that resists a single narrative, and a reminder that September’s rotations have been stock-specific rather than sector-wide.
Losers: Fair Isaac, Edison International and Lululemon hit hardest
Fair Isaac fell 18.67% to $934.52, the sharpest weekly decline of any large-cap name tracked this week. Edison International (NYSE: EIX) dropped 17.56% to $56.62, and Lululemon Athletica (NASDAQ: LULU) slid 16.89% to $100.59.
Autodesk (NASDAQ: ADSK) fell 15.54% to $217.90, and Ciena (NYSE: CIEN) declined 15.42% to $321.40, closing out a bottom five with combined losses that dwarfed the index-level moves recorded across the SPY, QQQ and DIA proxies for the same five sessions.
The macro shift: yields ease, oil climbs
Government bond markets drifted lower in yield terms over the week. The 10-year US Treasury yield eased to 4.77% as of 3 September, down from 4.79% previously, according to data from the Federal Reserve Bank of St. Louis. The 2-year yield fell further, to 4.34% from 4.39%.
The 10-year/2-year spread narrowed slightly to 0.41 percentage points from 0.43, a modest compression that keeps the curve positively sloped but marginally less so than the prior reading.
Oil moved the other way. WTI crude spot prices rose to $91.48 a barrel as of 1 September, up from $87.03, a gain of more than 5% on the week that stood out against the muted moves elsewhere in the macro data.
The number of the week
Set against a 0.12% weekly move in the S&P 500, WTI crude’s jump to $91.48 a barrel was the sharpest single-week change in the macro data this week — a reminder that the calm at the index level did not extend to the commodity that feeds directly into input costs across the market’s most volatile stocks, from Edison International’s utilities exposure to Ciena’s supply chain.
This article is for information only and is not investment advice or a recommendation to buy or sell any asset. Markets move quickly; figures are correct as sourced at the time of writing. Always do your own research before making financial decisions.
