
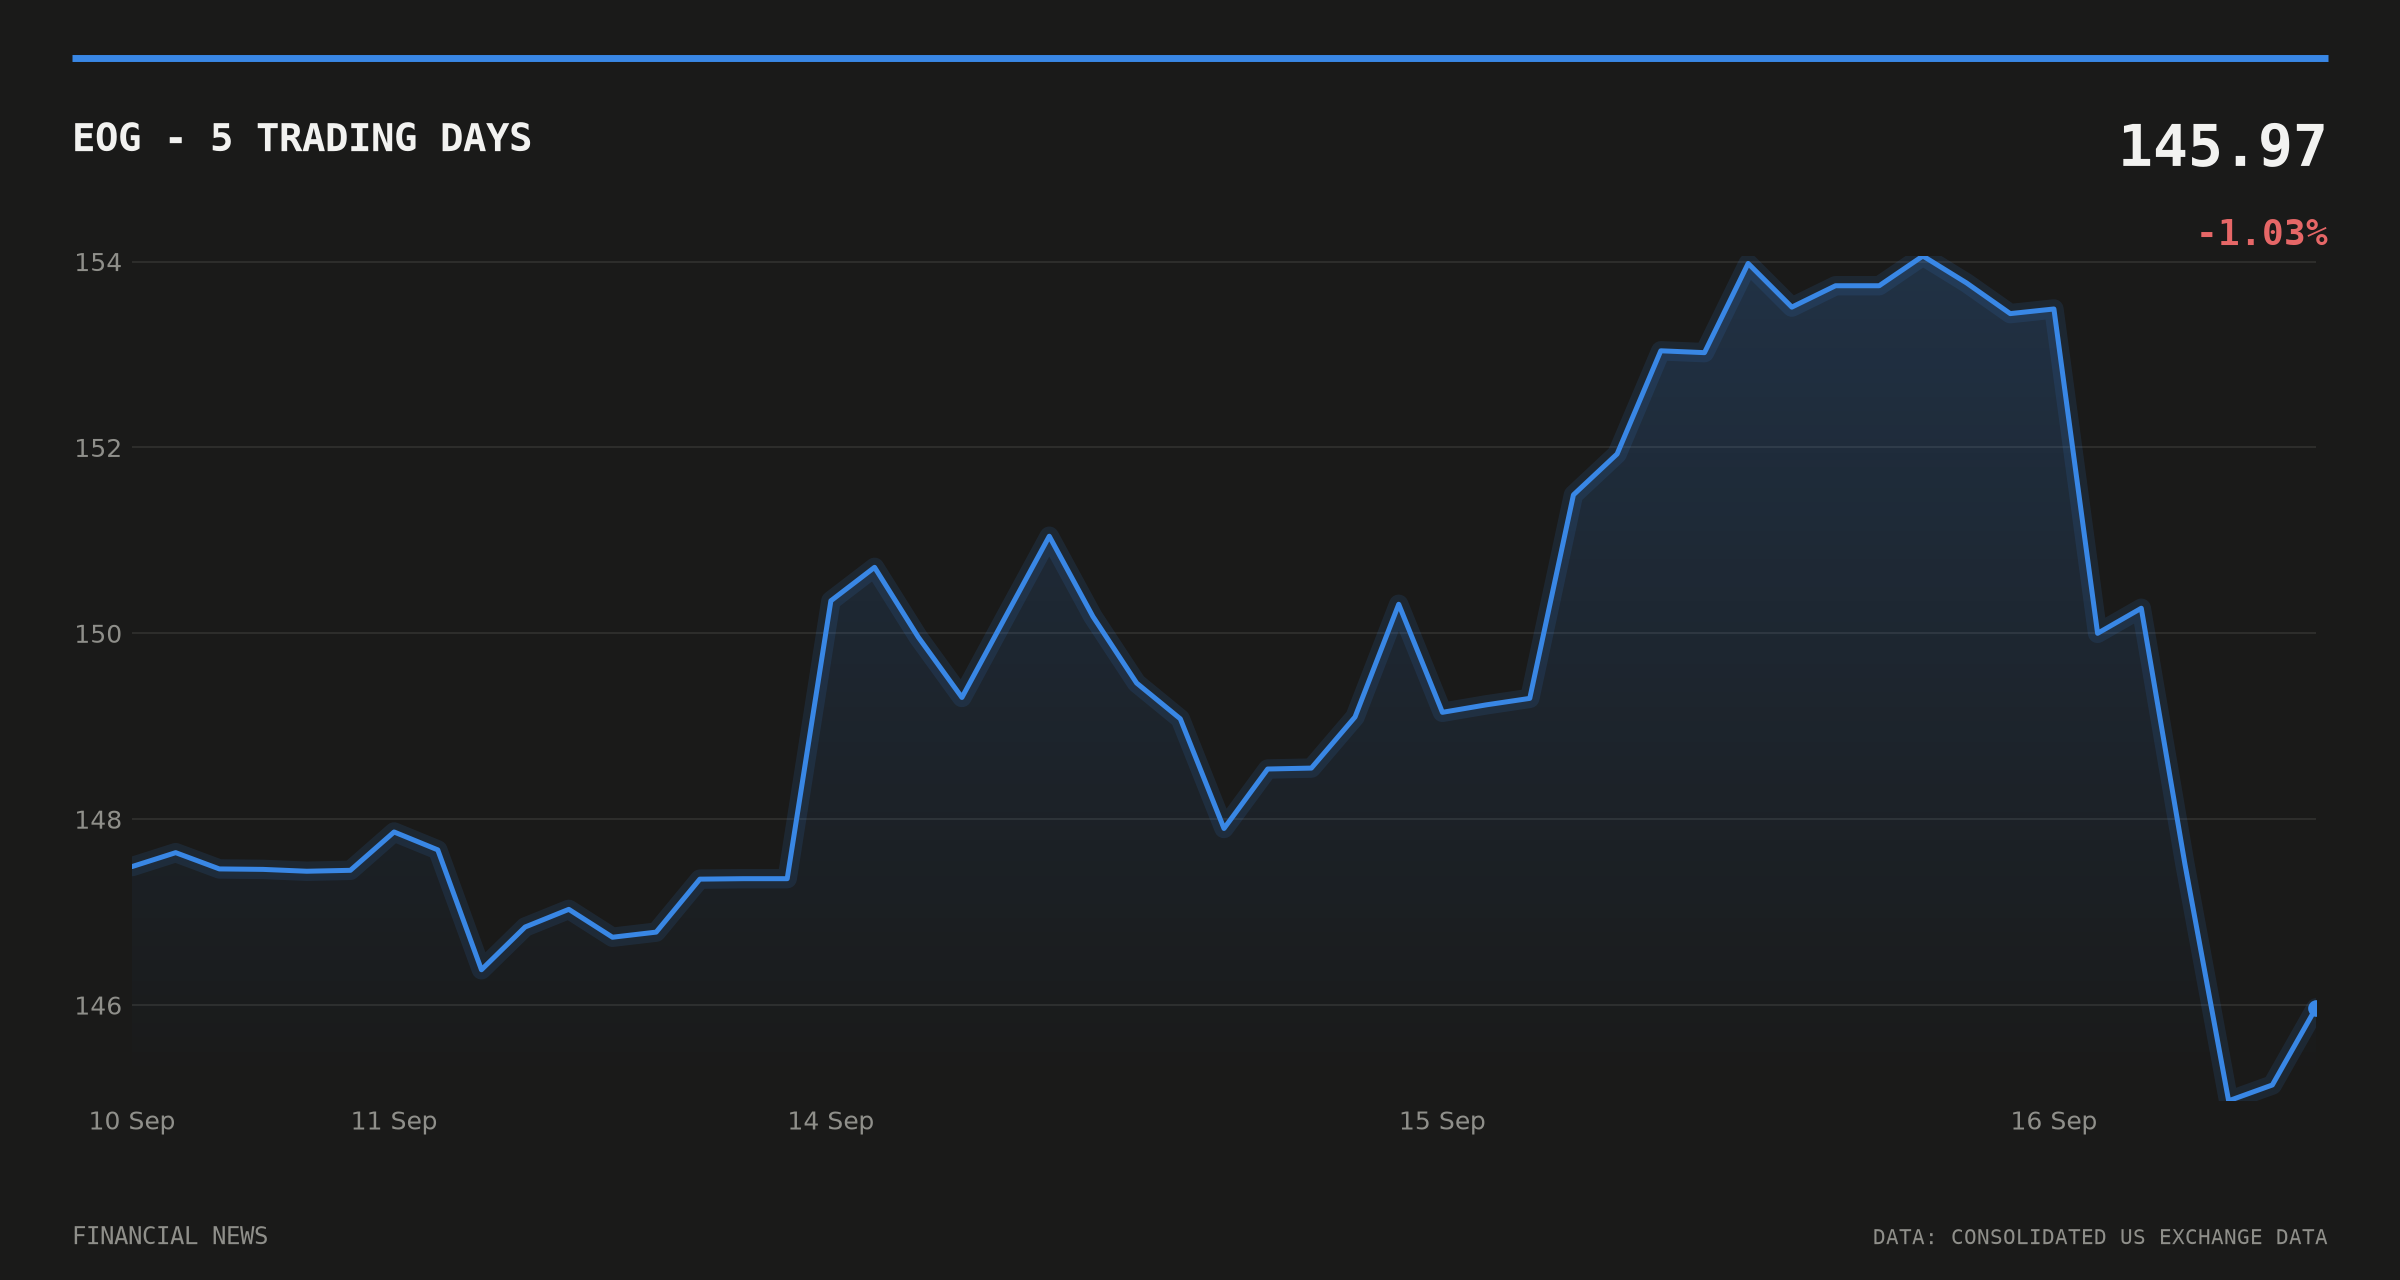

EOG Resources (EOG) shares fell 5% to close at $145.77 on 16 September 2026, as a retreat in crude oil prices dragged down producer stocks across the sector.
That is the figure in the consolidated exchange data tied to the stock’s 16:00 UTC snapshot on the day – a full percentage point below the 6% decline reported the same day by Yahoo Finance and repeated on 247wallst.com.
EOG Resources stock drop: the tape versus the wire
The two outlets carried identical wording and the same headline figure, pointing to a single syndicated piece rather than two independent reports. Neither offered a primary crude-price quote to underpin the “crude retreat” it named as the trigger.
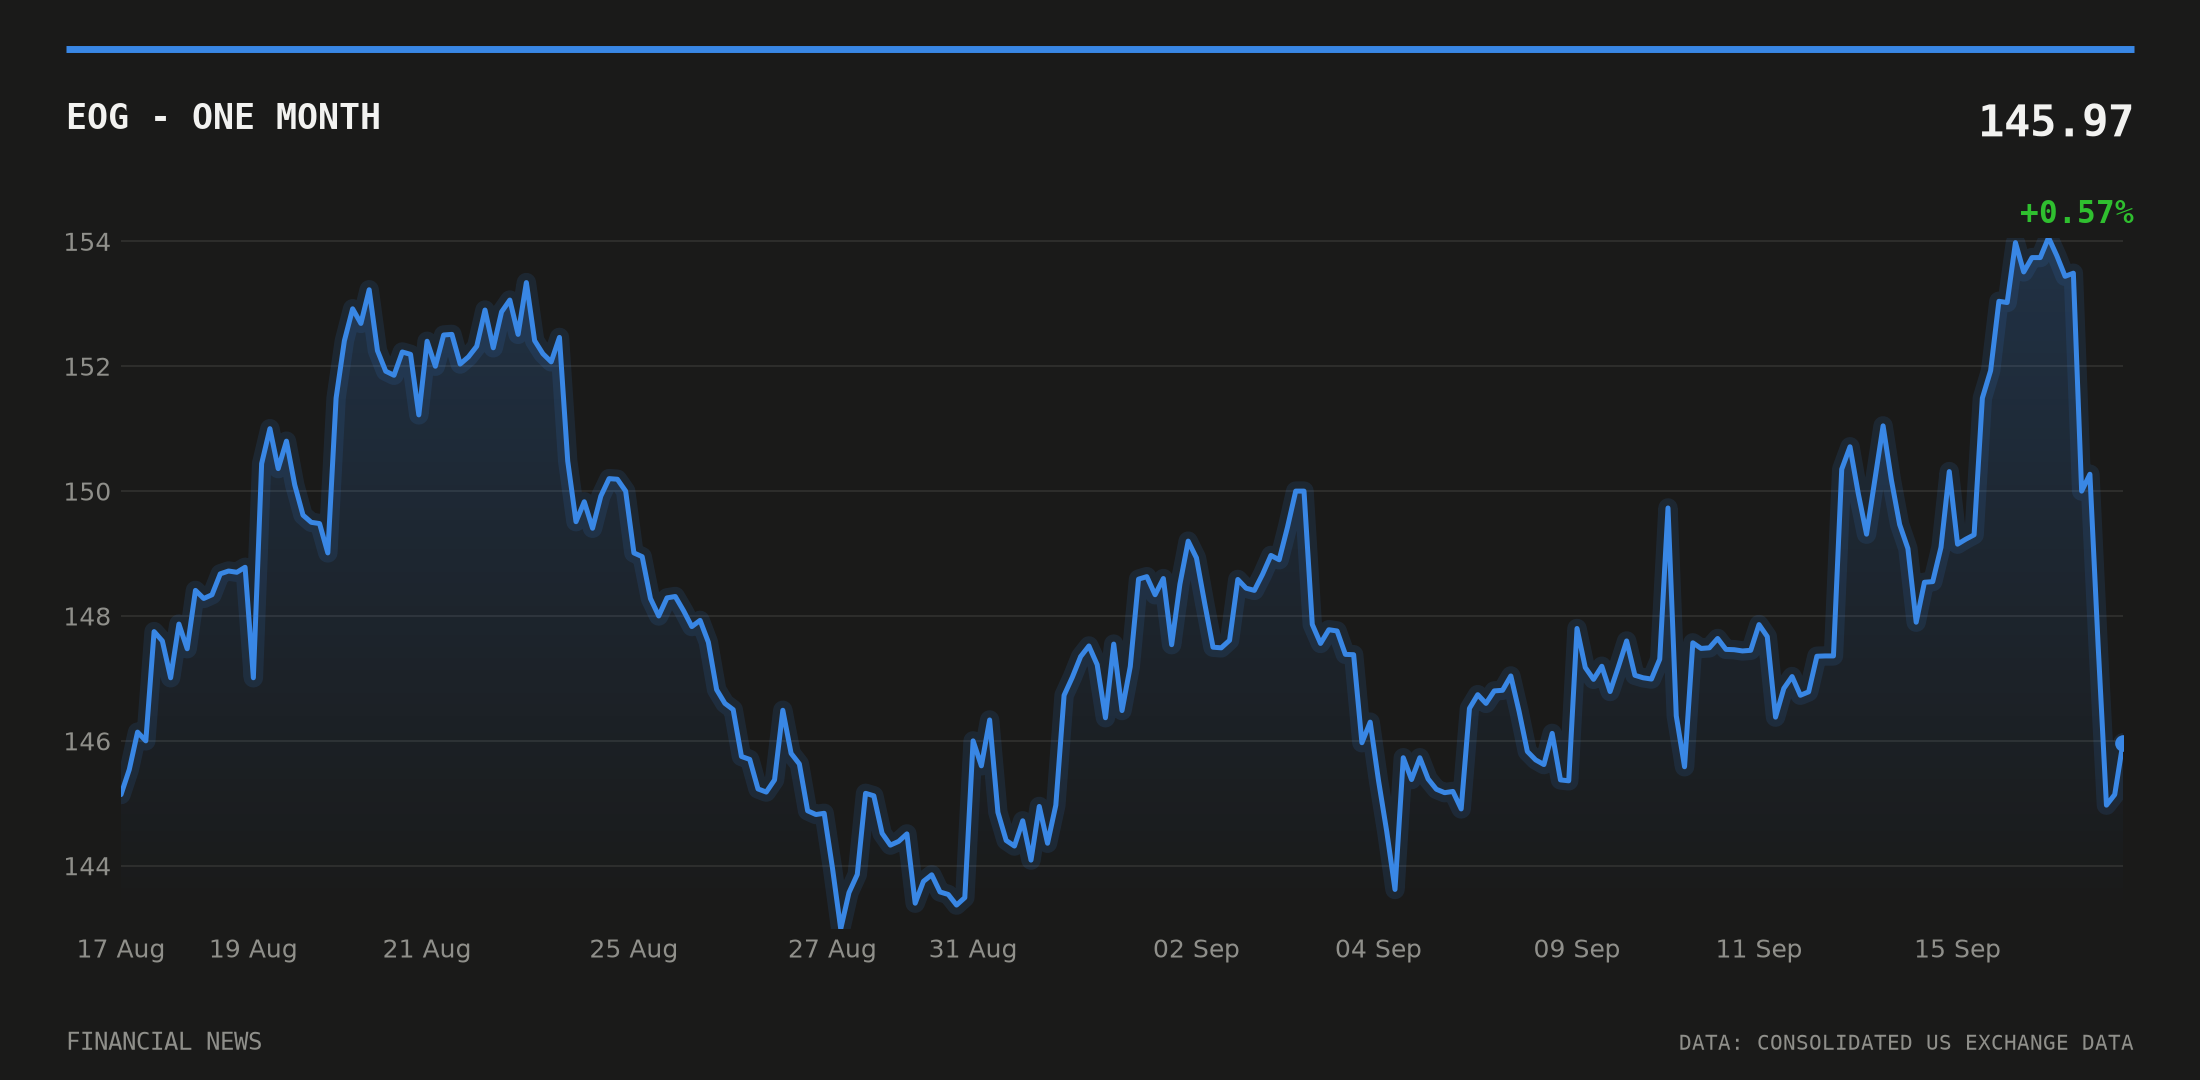
The EOG Resources stock drop of 5% is the number that squares with the point-in-time market data. The stock’s 20-day range ran from a low of $142.99 to a high of $154.06, putting Tuesday’s close near the bottom of that band. Trading volume ran at 0.78 times the 20-day average, not the surge that typically accompanies a panic sell-off.
The same wire report put ConocoPhillips and Occidental Petroleum down 5% apiece on the day. Financial News could not independently verify those two figures against exchange data, and neither company appears in the structured price record checked for this report.
No rates shock, no unusual short activity
Treasury yields, often a proxy for the macro backdrop behind energy trades, barely moved into the sell-off. The 10-year yield stood at 4.97% on 14 September against 4.96% the prior session, according to Federal Reserve data. The 2-year yield was similarly flat at 4.65% versus 4.63%, per the same source. Neither shift points to a rates-driven rotation out of energy names.
FINRA’s daily short-sale data shows nothing abnormal either. EOG’s short-volume ratio stood at 0.608 on 15 September and 0.63 the day before, in line with readings through most of the month, according to FINRA’s short-sale volume record. That leaves little support for a theory that short-covering or fresh short pressure drove the size of the move.
A Form 4 filed with the SEC on 14 September by EOG insider Michael P. Donaldson predates the share-price move by two days and is a routine Section 16 disclosure, according to the filing lodged with SEC EDGAR. Nothing in it points to a fundamental trigger for the sell-off.
Strong quarter, weak week
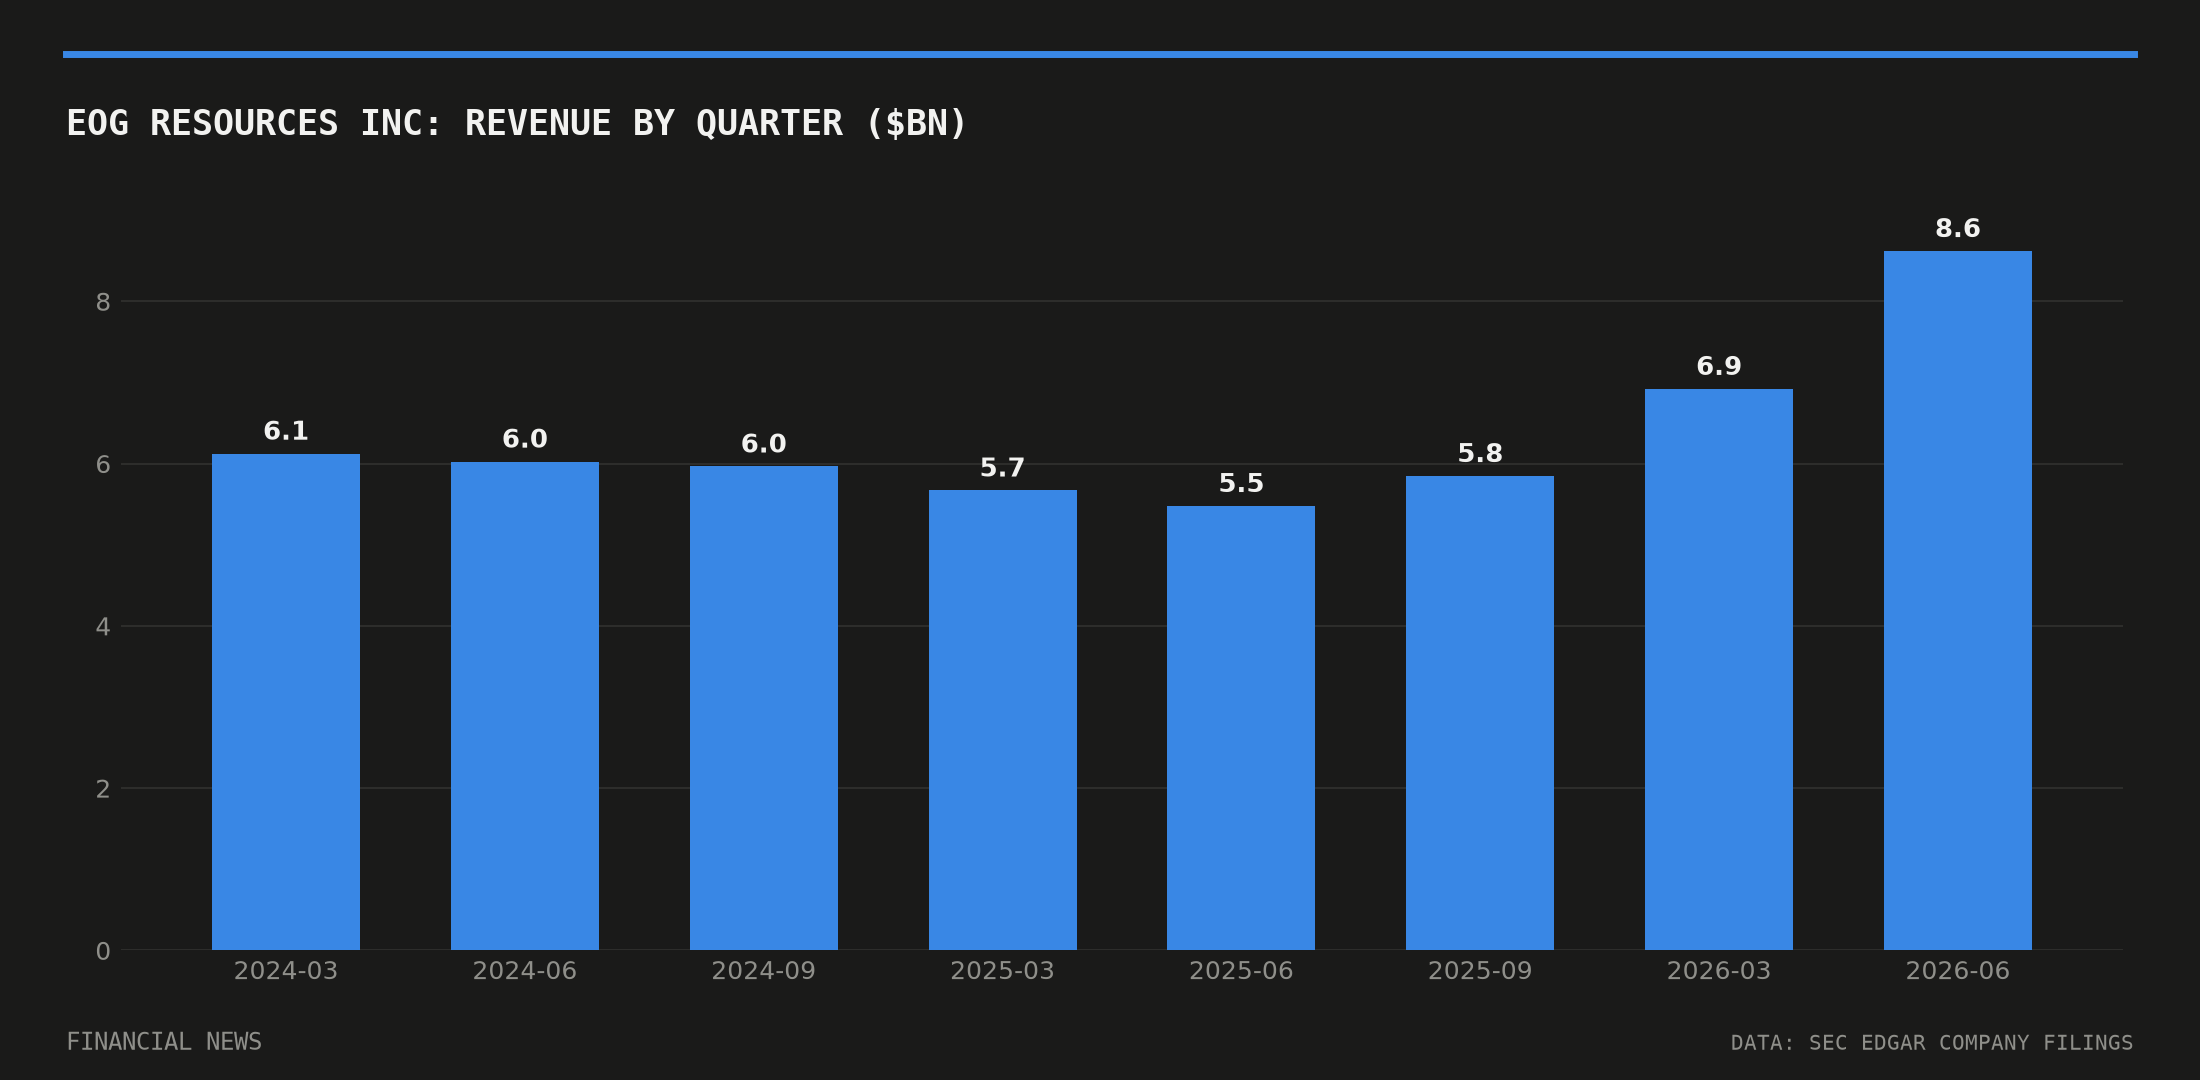
The pullback comes despite one of EOG’s stronger recent quarters. The company reported second-quarter revenue of $8.62bn and net income of $2.724bn, with diluted earnings per share of $5.15, according to its 10-Q filed with the SEC on 4 August. Both figures mark a step up from the first quarter’s $6.921bn revenue and $1.98bn net income.
That earnings strength sits awkwardly against the September share slide, reinforcing that the move looks tied to commodity pricing rather than company performance. Earlier coverage from 247wallst.com in May flagged the “energy trade” as crowded after crude climbed from a December low near $55 a barrel to an April peak near $115, warning that sharp pullbacks across the group were plausible once that run stalled.
Occidental Petroleum’s exposure to crude swings has been especially pronounced this year, with the stock’s year-to-date surge closely tracking oil’s advance, per its Yahoo Finance profile – a dynamic that could just as easily work in reverse when crude gives ground.
EOG itself is no stranger to sharp single-day swings. Shares fell more than 6% on 5 August after second-quarter results and updated production guidance, according to Traders Union – though that move was tied to earnings, not to crude pricing, unlike Tuesday’s decline.
Traders will be watching upcoming crude inventory data and OPEC+ output signals for confirmation of the pullback’s staying power, alongside EOG’s next scheduled filings with the SEC.
This article is for information only and is not investment advice or a recommendation to buy or sell any asset. Markets move quickly; figures are correct as sourced at the time of writing. Always do your own research before making financial decisions.
